Geochronology errors
Posted: Sat Mar 31, 2018 12:39 pm
According to Daniel’s Geochronology paper, the radiometric dating error grows over time. This is shown in the following data:
Conventional to Adjusted --- Source
4.6 billion to 80 million --- bperet post in this forum (search for billion)
65 million to 75,000 --- Geochronology, Footnote 13
50,000 BCE to 3761 BCE --- Geochronology
28,000 BCE to 2105 BCE --- Geochronology
9600 BCE to 1548 BCE --- Geochronology
2018 to 2018 --- Current year
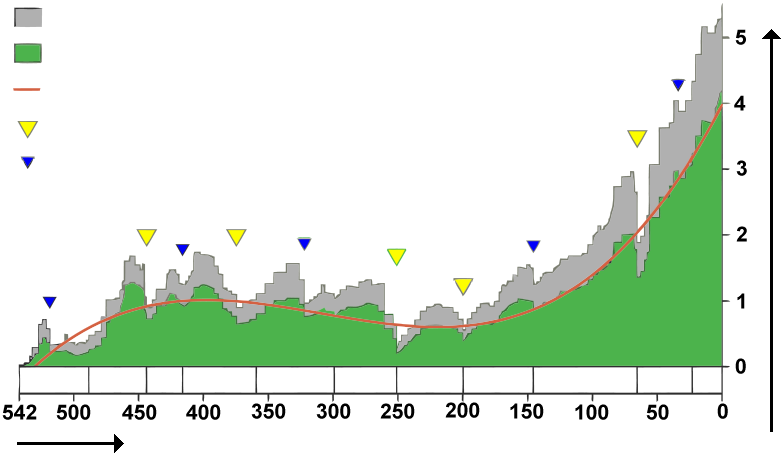
However, my contention is that the error growth should follow a pattern. I plotted the adjustment ratio versus years from today, and came up with the following:
Conventional to Adjusted = Ratio
4.6 billion to 80 million = 57.5
65 million to 75,000 = 866.7
50,000 (52,018 yrs) to 3761 BCE (5779 years) = 9.00
28,000 (30,018 yrs) to 2105 BCE (4123 years) = 7.28
9600 (11,618 yrs) to 1548 BCE (3566 years) = 3.26
2018 (0 years) to 2018 (0 years) = 1.0 (no error)
These results do not form a smooth curve, suggesting that some of these data points are incorrect.
I suspect the 65 million adjustment to 75,000 is incorrect, since if it is correct, a smooth curve relationship would dictate a much larger ratio for the 4.6 billion conversion.
I also suspect the 28,000 BCE adjustment to 2105 BCE is incorrect on the basis of a non-smooth curve when considering the four closest to now data points.
If a relationship is known to make these adjustments, it seems that the entire curve could be produced quite easily to help validate or disprove the data shown, as well as to provide insight into the conversion factor for other dates.
Any comments?
Conventional to Adjusted --- Source
4.6 billion to 80 million --- bperet post in this forum (search for billion)
65 million to 75,000 --- Geochronology, Footnote 13
50,000 BCE to 3761 BCE --- Geochronology
28,000 BCE to 2105 BCE --- Geochronology
9600 BCE to 1548 BCE --- Geochronology
2018 to 2018 --- Current year
However, my contention is that the error growth should follow a pattern. I plotted the adjustment ratio versus years from today, and came up with the following:
Conventional to Adjusted = Ratio
4.6 billion to 80 million = 57.5
65 million to 75,000 = 866.7
50,000 (52,018 yrs) to 3761 BCE (5779 years) = 9.00
28,000 (30,018 yrs) to 2105 BCE (4123 years) = 7.28
9600 (11,618 yrs) to 1548 BCE (3566 years) = 3.26
2018 (0 years) to 2018 (0 years) = 1.0 (no error)
These results do not form a smooth curve, suggesting that some of these data points are incorrect.
I suspect the 65 million adjustment to 75,000 is incorrect, since if it is correct, a smooth curve relationship would dictate a much larger ratio for the 4.6 billion conversion.
I also suspect the 28,000 BCE adjustment to 2105 BCE is incorrect on the basis of a non-smooth curve when considering the four closest to now data points.
If a relationship is known to make these adjustments, it seems that the entire curve could be produced quite easily to help validate or disprove the data shown, as well as to provide insight into the conversion factor for other dates.
Any comments?